Dashは,データの可視化・インタラクティブなグラフの操作を行うことができるWebアプリケーションを作成することができます。
本記事では,Dashの構成要素の一つであるhtmlモジュールの使い方を解説したいと思います。
この記事を通して,↓のようなアプリを作成することができます。
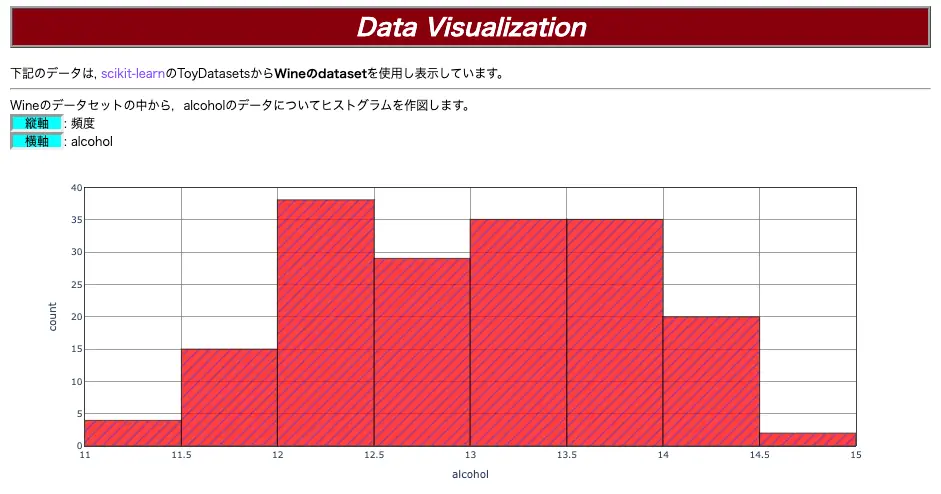
*こちらのコードは,まとめにあります。
ライブラリのインポート
まずは,ライブラリのインポートを行います。
今回,Dashのアプリを作成する上で必要なのは,from dash import Dash, html, dcc
になります。
また表示用のデータには,scikit-learnのワインのデータセット(公式サイト)を使用しました。
#ライブラリのインポート
from sklearn import datasets
import pandas as pd
import plotly.graph_objects as go
from dash import Dash, html, dcc

#ワインデータの読み込み
data =  datasets.load_wine()
X=data['data']
Y=data['target']
wine_X = pd.DataFrame(X, columns=data['feature_names'])
df_wine = wine_X.copy()
df_wine['target']=Y
df_wine
Dashアプリケーションの作成
Dashでアプリケーションを作成していきます。
この記事を通して,下図を作成します。
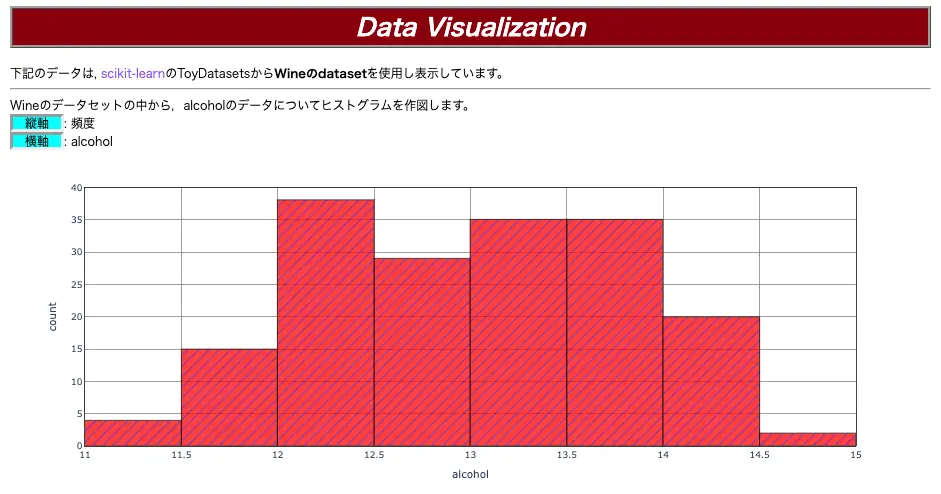
早速ですが,コードは↓です。
#ヒストグラムの作図
fig = go.Figure()
fig.add_trace(go.Histogram(x=df_wine['alcohol'],
                           name='wine',
                           marker=dict(color='red',
                                       line=dict(color='black',
                                                 width=1),
                                       opacity=0.8,
                                       pattern=dict(fgcolor='blue',
                                                    shape='/',
                                                    size=10)),
                           ))
# 背景,軸の色
fig.update_layout(plot_bgcolor="white", margin=dict(t=50, b=50, l=100, r=100))
fig.update_xaxes(title='alcohol',linecolor='black', gridcolor='gray',mirror=True)
fig.update_yaxes(title='count',linecolor='black', gridcolor='gray',mirror=True)

#Dashアプリの作成
app = Dash(__name__)
#コンテナ作成
app.layout = html.Div(
    children=[
        html.H1(
            children=['Data Visualization'],
            style={'font-weight': 'bold',
                   'textAlign':'center',
                   'color':'rgb(255, 255,255)',
                   'backgroundColor': 'rgb(137, 0, 13)',
                   'font-style': 'italic',
                   'border-style':'ridge',
                   'border-color':'rgb(160, 160, 160)'
                   }
            ),
        html.P(children=['下記のデータは, '], style={'display':'inline'}),
        html.Div(children=['scikit-learn'], style={'color':'rgb(140, 73, 255)', 'display':'inline'}),
        html.Div(children=['のToyDatasetsから', html.B('Wineのdataset'),'を使用し表示しています。'], style={'display':'inline'}),
        html.Hr(),
        html.Div(children=['Wineのデータセットの中から,alcoholのデータについてヒストグラムを作図します。'], style={'display':'inline'}),
        html.Br(),
        html.Div(children=[' 縦軸 '], style={'display':'inline', 'border-style':'inset', 'backgroundColor':'rgb(0,255,255)'}),
        html.Div(children=[': 頻度'], style={'display':'inline'}),
        html.Br(),
        html.Div(children=[' 横軸 '], style={'display':'inline', 'border-style':'inset', 'backgroundColor':'rgb(0,255,255)'}),
        html.Div(children=[': alcohol'], style={'display':'inline'}),
        dcc.Graph(
                id='example-graph',
                figure=fig
                ),
    ],

)
#アプリの実行
if __name__ == '__main__':
    app.run(debug=True)
2-16行目まではグラフ,19行目以降でdashを使ったアプリの作成を行なっています。
グラフの作成については,↓を参考にしてください。
19行目以降でDashのアプリを作成します。
基本構成は,↓を参考にしてください。
app = Dash(__name__)
app.layout = html.Div(
    children=[
        ...
    ],
    style={...}
)

if __name__ == '__main__':
app.run(debug=True)| app = Dash(__name__) | Dashのアプリケーションの作成 |
| app.layout = html.Div(children=[…], style={…}) | アプリのレイアウトを構成するコンテナ要素 children=[…] に構成要素を追加する |
| if __name__ == ‘__main__’: app.run.server(debug=True) | アプリケーションの実行 |
上記のコードでは,
19行目: app = Dash(__name__)
21行目: app.layout = html.Div(children=[...])_name__)
53,54行目: if __name__ == '__main__':
app.run.server(debug=True)
になっています。
app.layout = html.Div(children=[...])に要素を追加することで,いろいろな表現ができるようになります。
例えば,以下の3-5行目のように,htmlタグを追加していきます。またその表示方法をstyleで設定していきます。
app.layout = html.Div(
    children=[
        html.H1(children=[...], style={...}),
        html.Div(children=[...], style={...}),
       ...,
    ],
    style={...}
)
以下では,
まず,基本的な構成要素であるhtmlを解説して行きます。
その後,styleについて解説します。
htmlコンポーネント
Dashでは,多数のhtmlコンポーネントが用意されています。
詳しくは公式HPをご確認ください。
この章では,よく使われるであろうhtml タグについて紹介していきたいと思います。
| html.H1 | 見出しタグ |
| html.H2 | 見出しタグ |
| html.H3 | 見出しタグ |
| html.H4 | 見出しタグ |
| html.H5 | 見出しタグ |
| html.H6 | 見出しタグ |
| html.div | divタグ,対象範囲をブロック要素とできる |
| html.B | 太字,強調表現 |
| html.I | イタリック体の表示 |
| html.Br | 改行 |
| html.Hr | 水平線の表示 |
| html.Label | ラベルタグの表示 |
| html.U | アンダーラインの表示 |
| html.Textarea | テキストエリアの表示 |
| html.Var | 変数や引数を示す,イタリック体で表示 |
それぞれ詳しくみていきます。
html.H1 〜 html.H6
ここでは,
html.H1,
html.H2,
html.H3,
html.H4,
html.H5,
html.H6
の見出しタグの違いについて,確認していこうと思います。
html.H1の見出しが一番大きく,次にhtml.H2, html.H3の順となります。
結果としては,以下です。
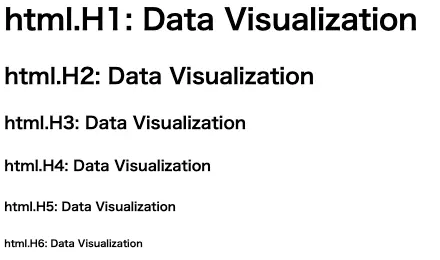
コードについては,以下を参照ください。
app = Dash(__name__)

app.layout = html.Div(
    children=[
        html.H1(
            children=['html.H1: Data Visualization'],
        ),
        html.H2(
            children=['html.H2: Data Visualization'],
        ),
        html.H3(
            children=['html.H3: Data Visualization'],
        ),
        html.H4(
            children=['html.H4: Data Visualization'],
        ),
        html.H5(
            children=['html.H5: Data Visualization'],
        ),
        html.H6(
            children=['html.H6: Data Visualization'],
        ),
        ]
    )

if __name__ == '__main__':
    app.run(debug=True, port=500)
html.div
次は,html.Divについてです。
html.Divは,前述のhtml.H1の見出しタグのように,特に意味を持つタグではないですが,html.Divで囲った領域を一つのブロックとして扱うことができます。
実際,前章のコードの3行目でも使用しており,html.H1〜html.H6の例を一つのブロックにして,app.layoutとしました。
html.Div単体で文字を出力することもでき,以下のようになります。

コードは↓です。
app = Dash(__name__)

app.layout = html.Div(
    html.Div(
        children='Data Visualization'
    )
)
if __name__=='__main__':
    app.run(debug=True)
また,上記のコードのようにhtml.Divを入れ子にすることもできます。
次の章で紹介しますが,html.divで囲った領域を一つのブロックとすることで,styleの設定を一括で行うことが可能になります。
html.B & html.I
html.Bタグは太文字,html.Iタグはイタリック体 に表現することができます。
わかりやすいように,以下ではhtml.Div, html.B, html.I で比較します。

コードは以下です。
app = Dash(__name__)

app.layout = html.Div(
    children=[
        html.Div(children='html.Div:Data Visualization'),
        html.B(children='html.B:Data Visualization'),
        html.Br(),
        html.I(children='html.I:Data Visualization'),
    ]
)
if __name__=='__main__':
    app.run(debug=True)
5行目でhtml.Div, 6行目でhtml.B, 7行目でhtml.I の表記になっています。
また,以下のように一つの文の中で組み合わせて使うこともできます。

app = Dash(__name__)

app.layout = html.Div(
    children=[
        html.Div(children=['html.B&I: ', html.B('Data'), html.I('Visualization')]),
    ]
)
if __name__=='__main__':
    app.run(debug=True)
html.Br
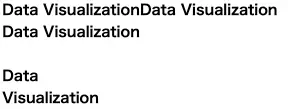
html.Brタグは改行ができます。
以下の結果とコードを確認ください
app = Dash(__name__)

app.layout = html.Div(
    children=[
        html.B('Data Visualization'),
        html.B('Data Visualization'),
        html.Br(),
        html.B('Data Visualization'),
        html.Br(),
        html.Br(),
        html.B(children=['Data',html.Br(),'Visualization']),
    ]
)

if __name__=='__main__':
    app.run(debug=True)
5,6行目はhtml.Br()の改行がないので,出力結果はData Visualizationが連続して出力されてますが,7行目にはhtml.Br()があるため,その次は改行して出力されます。
また,11行目のように,他のタグの中で使用することもできます。
html.Hr
続いて,html.Hrタグを見ていきます。
html.Hrを使うと以下のように下線を引くことができます。

コードは以下です。
app = Dash(__name__)

app.layout = html.Div(
    children=[
        html.Div('Data Visualization'),
        html.Hr(),
        html.Br(),
        html.Hr(),
        html.Hr()
    ]
)

if __name__=='__main__':
    app.run(debug=True)
html.Label&html.textarea
html.Labelとhtml.textareaを合わせて確認します。
html.Labelタグは,テキストボックスなどの入力フォームに名前や説明をつけるために使います。
html.textareaタグは,テキストエリアを表現できます。
html.Labelとhtml.textareaを合わせて使いますと,下記のようになります。
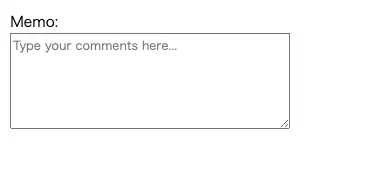
コードは以下になります。
app = dash.Dash(__name__)

app.layout = html.Div(
    children=[
        html.Label("Memo:"),
        html.Br(),
        html.Textarea(id="comments", placeholder="Type your comments here...", rows=5, cols=40),
])

if __name__ == '__main__':
    app.run(debug=True)
html.Textareaの中身ですが,以下の表にまとめているので参照ください。
| id | 識別子(コールバック時に使用) |
| placeholder | ユーザーが入力する前に表示されるテキスト |
| rows | テキストエリアの表示桁数(デフォルトは2) |
| cols | テキストエリアの横幅 |
| maxLength | 最大文字数 |
htmlのstyle
htmlコンポーネントは,styleで様々な設定を行うことができます。
以下に,styleで設定できる代表的な項目を紹介します。
| font-size | 文字サイズ |
| font-style | 文字のスタイル(斜体にするかどうか) normal: 標準,italic: 斜体 |
| font-weight | 文字の太さ normal: 標準(400) bold: 太字(700) 100〜900: 太字 |
| fontFamily | 文字のフォント種類 |
| color | 文字の色 |
| backgroundColor | 背景の色 |
| height | 要素の高さ |
| width | 要素の幅 |
| textAlign | 文字の水平方向の位置 left: 左揃え right: 右揃え center: 中心揃え justify: 両端揃え |
| padding | 要素の内側の余白 |
| margin | 要素の外側の余白 |
| position | 要素の位置 static: デフォルト,位置指定なし relative: 元の位置から相対位置で指定 absolute: 位置指定された親要素から絶対位置で指定 fixed: ビューポートを基準に固定 sticky: 画面をスクロールしても指定位置で固定 |
| display | 要素の表示設定 block: 新しい行に要素を表示 inline: 他のインライン要素と同じ行内で表示 inline-block: サイズを変更できインラインで表示 none: 要素の非表示 |
| border-style | 線の種類 solid: 実線 dashed: 点線 dotted: 破線 double: 二重線 groove: 凹型の境界線 ridge: 凸型の境界線 inset: 内側に押し込まれた境界線 outset: 外側に膨らんだ境界線 none: なし hidden: 隠れた線 |
| border-color | 線の色 |
| border-width | 線の太さ |
| border-radious | 要素の角の丸みの設定 |
| opacity | 要素の透明度 |
| box-shadow | 要素に影を追加 |
それぞれの項目について以下で解説していきます。
font-size
font-sizeは,その名の通りフォントサイズの設定を行うことができます。
フォントサイズの設定方法としては,’rem’,’pix’, ‘%’などがあります。
以下の例では,’rem’を使っていますが,状況に応じて使い分けてください。

コードはこちらです。
app = dash.Dash(__name__)

app.layout = html.Div(
    children=[
        html.Div(
            children=['Data Visualization'],
        ),
        html.Div(
            children=['size 1.5rem: Data Visualization'],
            style={'font-size':'1.5rem'}
        ),
        html.Div(
            children=['size 2.5rem: Data Visualization'],
            style={'font-size':'2.5rem'}
        ),
    ]
)

if __name__ == '__main__':
    app.run(debug=True)
font-style
文字のスタイルを,斜体にするかどうか設定できます。

コードは↓です。
app = dash.Dash(__name__)

app.layout = html.Div(
    children=[
        html.Div(
            children=['style normal: Data Visualization'],
            style={'font-style':'normal'}
        ),
        html.Div(
            children=['style italic: Data Visualization'],
            style={'font-style':'italic'}
        ),
    ]
)

if __name__ == '__main__':
    app.run(debug=True)
font-weight
font-weightでは,文字の太さを設定できます。

コードは以下になります
app = dash.Dash(__name__)

app.layout = html.Div(
    children=[
        html.Div(
            children=['weight normal: Data Visualization'],
            style={'font-weight':'normal'}
        ),
        html.Div(
            children=['weight italic: Data Visualization'],
            style={'font-weight':'bold'}
        ),
        html.Div(
            children=['weight 100: Data Visualization'],
            style={'font-weight':'100'}
        ),
        html.Div(
            children=['weight 900: Data Visualization'],
            style={'font-weight':'900'}
        ),
    ]
)

if __name__ == '__main__':
    app.run(debug=True)
fontFamily
fontFamilyでは,文字のフォント種類を設定できます。
選択できるフォント種類はいろいろありますので,以下のHPを参考に確認してみてください
https://fromkato.com/webdev/css/properties/font-family
ここではいくつか例を紹介します

コードはこちら
app = dash.Dash(__name__)

app.layout = html.Div(
    children=[
        html.Div(
            children=['weight Arial: Data Visualization'],
            style={'font-family':'Arial'}
        ),
        html.Div(
            children=['weight Century: Data Visualization'],
            style={'font-family':'Century'}
        ),
        html.Div(
            children=['weight Meiryo: Data Visualization'],
            style={'font-family':'Meiryo'}
        ),
        html.Div(
            children=['weight HiraKakuProN: Data Visualization'],
            style={'font-family':'HiraKakuProN'}
        ),
    ]
)

if __name__ == '__main__':
    app.run(debug=True)
color
colorは文字のカラーの変更ができます。
ここでは,カラーをrgbで指定した変更を紹介したいと思います。
rgb表記で,何色になるかなどは下記のサイトがとても参考になります。
https://www.colordic.org/picker

コードはこちら↓
app = dash.Dash(__name__)

app.layout = html.Div(
    children=[
        html.Div(
            children=['color rgb(255,0,0): Data Visualization'],
            style={'color':'rgb(255,0,0)'}
        ),
        html.Div(
            children=['color rgb(0,255,0): Data Visualization'],
            style={'color':'rgb(0,255,0)'}
        ),
        html.Div(
            children=['color rgb(0,0,255): Data Visualization'],
            style={'color':'rgb(0,0,255)'}
        ),
    ]
)

if __name__ == '__main__':
    app.run(debug=True)
backgroundColor
backgroundColorは,背景色を設定することができます。
こちらも先程のcolorと同様にrgbで指定してみました。

コードは以下になります。
app = dash.Dash(__name__)

app.layout = html.Div(
    children=[
        html.Div(
            children=['backgroundColor rgb(255,0,0): Data Visualization'],
            style={'backgroundColor':'rgb(255,0,0)'}
        ),
        html.Div(
            children=['backgroundColor rgb(0,255,0): Data Visualization'],
            style={'backgroundColor':'rgb(0,255,0)'}
        ),
        html.Div(
            children=['backgroundColor rgb(0,0,255): Data Visualization'],
            style={'backgroundColor':'rgb(0,0,255)'}
        ),
    ]
)

if __name__ == '__main__':
    app.run(debug=True)
height & width
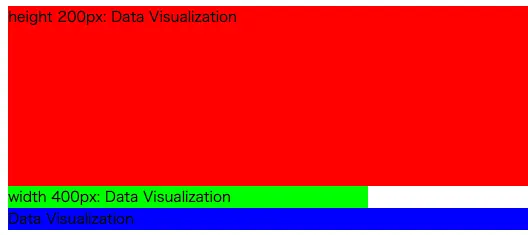
heightは要素の高さ, widthは要素の幅を設定することができます。
pxや%で設定できます。
ここでは,変更したことがわかるようにbackgroundColorもそれぞれ変更してあります。
赤色の背景はheightを変更しており,緑色の背景はwidthを変更しております。
青色はデフォルトのままです。
コードは↓になります。
app = dash.Dash(__name__)

app.layout = html.Div(
    children=[
        html.Div(
            children=['height 200px: Data Visualization'],
            style={'height':'200px','backgroundColor':'rgb(255,0,0)'}
        ),
        html.Div(
            children=['width 400px: Data Visualization'],
            style={'width':'400px','backgroundColor':'rgb(0,255,0)'}
        ),
        html.Div(
            children=['Data Visualization'],
            style={'backgroundColor':'rgb(0,0,255)'}
        )
    ]
)

if __name__ == '__main__':
    app.run(debug=True)
textAlign
texAlignは,文字の水平方向の位置を変更することができます。
texAlignで,left, right, centerについて紹介します。
ここでも,わかりやすいように背景色で分けてあります。

コードです↓
app = dash.Dash(__name__)

app.layout = html.Div(
    children=[
        html.Div(
            children=['textAlign left: Data Visualization'],
            style={'textAlign':'left','backgroundColor':'rgb(255,0,0)'}
        ),
        html.Div(
            children=['textAlign right: Data Visualization'],
            style={'textAlign':'right','backgroundColor':'rgb(0,255,0)'}
        ),
        html.Div(
            children=['textAlign center: Data Visualization'],
            style={'textAlign':'center','backgroundColor':'rgb(0,0,255)'}
        )
    ]
)

if __name__ == '__main__':
    app.run(debug=True)
padding
paddingは,要素の中の余白の設定を行うことができます。
paddingによって,上下左右の余白を設定できます。

app = dash.Dash(__name__)

app.layout = html.Div(
    children=[
        html.Div(
            children=['padding 20px: Data Visualization'],
            style={'padding':'20px','backgroundColor':'rgb(255,0,0)'}
        ),
        html.Div(
            children=['padding 5px20px: Data Visualization'],
            style={'padding':'5px 20px','backgroundColor':'rgb(0,255,0)'}
        ),
        html.Div(
            children=['padding-top 20px: Data Visualization'],
            style={'padding-top':'20px','backgroundColor':'rgb(0,0,255)'}
        ),
        html.Div(
            children=['padding-left 20px: Data Visualization'],
            style={'padding-left':'20px','backgroundColor':'rgb(0,255,255)'}
        ),
    ]
)

if __name__ == '__main__':
app.run(debug=True)ここで,'padding':'20px' は上下左右の余白が20px,'padding':'5px 20px' は上下の余白が5px, 左右の余白が20px,'padding-top':'20px'は上の余白が20px,'padding-left':'20px'は左の余白が20px
となります。
また,'padding-bottom', 'padding-right'によって下と右の余白のみを設定することもできます。
margin
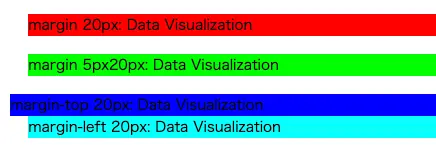
marginは,先程のpaddingと異なり要素の外側の余白を変更できます。
少しわかりにくかもしれませんが,以下のように要素の外側の余白が変更できています。先程のpaddingと比較するとわかりやすいかもしれません。
app = dash.Dash(__name__)

app.layout = html.Div(
    children=[
        html.Div(
            children=['margin 20px: Data Visualization'],
            style={'margin':'20px','backgroundColor':'rgb(255,0,0)'}
        ),
        html.Div(
            children=['margin 5px20px: Data Visualization'],
            style={'margin':'5px 20px','backgroundColor':'rgb(0,255,0)'}
        ),
        html.Div(
            children=['margin-top 20px: Data Visualization'],
            style={'margin-top':'20px','backgroundColor':'rgb(0,0,255)'}
        ),
        html.Div(
            children=['margin-left 20px: Data Visualization'],
            style={'margin-left':'20px','backgroundColor':'rgb(0,255,255)'}
        ),
    ]
)

if __name__ == '__main__':
    app.run(debug=True)
position
positionでは,要素の位置を設定できます。
設定の仕方としては,static, relative, absolute, fixed, stickyがあります。
staticはデフォルト設定であり,relative, absolute, fixed, stickyについては,top, bottom, left, rightにより詳細に要素の位置を決めることができます。
ここでは,relative, absoluteを実例を基に紹介します。
まずはrelativeですが,元々配置される位置を基準に相対的に移動します。
下図では,緑背景のData Visualizationは元々,赤背景と青背景の間に配置されるはずでしたが,その位置を基準として相対移動をしています。また、このとき他の要素のレイアウトには影響を与えないので、赤背景と青背景の間は空いたままになっています。

コードも併せて確認するとわかりやすいと思います
app = Dash(__name__)

app.layout = html.Div(
    children=[
        html.Div(
            children=['color rgb(255,0,0): Data Visualization'],
            style={'backgroundColor':'rgb(255,0,0)'}
        ),
        html.Div(
            children=['color rgb(0,255,0): Data Visualization'],
            style={'position':'relative', 'top':'50px', 'left':'50px','backgroundColor':'rgb(0,255,0)'}
        ),
        html.Div(
            children=['color rgb(0,0,255): Data Visualization'],
            style={'backgroundColor':'rgb(0,0,255)'}
        ),
    ]
)

if __name__ == '__main__':
app.run(debug=True)次に,absoluteですが親要素の枠内で絶対的に移動します。
先ほどのrelativeと異なり,他の要素のレイアウトに影響を及ぼし、赤背景の後にすぐに青背景が来ています。
(本来の順番では,赤→緑→青背景の順番)
また,absoluteでは他の要素と重なることもあります。

app = Dash(__name__)

app.layout = html.Div(
    children=[
        html.Div(
            children=['color rgb(255,0,0): Data Visualization'],
            style={'backgroundColor':'rgb(255,0,0)'}
        ),
        html.Div(
            children=['color rgb(0,255,0): Data Visualization'],
            style={'position':'absolute', 'top':'50px', 'left':'50px','backgroundColor':'rgb(0,255,0)'}
        ),
        html.Div(
            children=['color rgb(0,0,255): Data Visualization'],
            style={'backgroundColor':'rgb(0,0,255)'}
        ),
    ]
)

if __name__ == '__main__':
app.run(debug=True)fixedとstickyについては簡単に紹介します。
fixedでは,要素をブラウザウィンドに対して固定することができ,ヘッダーやフッターのような使い方ができます。stickyでは,特定のスクロール位置に達すると,指定された位置の固定することができます。
display
displayは,要素の表示方法を設定することができます。
ここでは,block, inline, inline-block, noneの4つを紹介したいと思います。
再掲ですが,block: 新しい行に要素を表示inline: 他のインライン要素と同じ行内で表示inline-block: サイズを変更でき、かつインライン表示none: 要素の非表示
となります。
まずblock, inline, inline-blockについてみてみます。
少し順番が逆転していますが,下図で赤背景と緑背景がinlineであるため、同じ行内で表示されています。
青色は,inline-blockなので,赤背景と緑背景と同じ行以内ですが,高さを変えて表示することができます。
そして、水色背景がblockなので新しい行に表示されます。

次は,先ほどの例を用いてnoneをみたいと思います。下図は先ほどとほぼ同じですが,緑色をnoneにしています。このため下図では緑色背景部分は非表示となっています。

border-style
border-styleは,要素の境界線の種類を選択することができます。
選択できる種類は多数あるので,実際に下図でご確認ください。
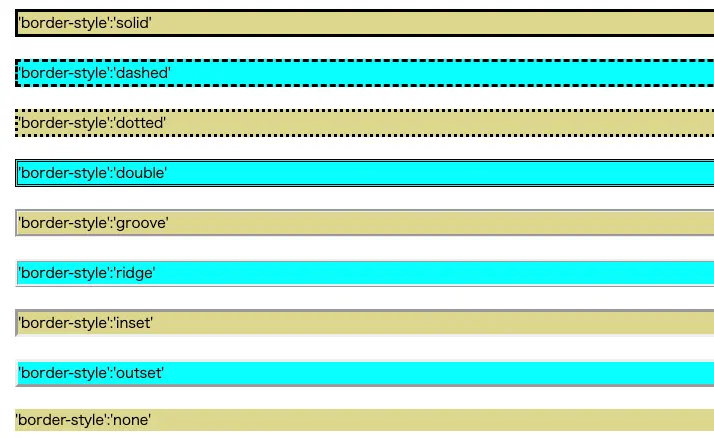
コードはこちら↓
app = Dash(__name__)

app.layout = html.Div(
    children=[
        html.Div(
            children=["'border-style':'solid'"],
            style={'border-style':'solid', 'backgroundColor':'rgb(221,213,141)'}
        ),
        html.Br(),
        html.Div(
            children=["'border-style':'dashed'"],
            style={'border-style':'dashed', 'backgroundColor':'rgb(0,255,255)'}
        ),
        html.Br(),
        html.Div(
            children=["'border-style':'dotted'"],
            style={'border-style':'dotted', 'backgroundColor':'rgb(221,213,141)'}
        ),
        html.Br(),
        html.Div(
            children=["'border-style':'double'"],
            style={'border-style':'double', 'backgroundColor':'rgb(0,255,255)'}
        ),
        html.Br(),
        html.Div(
            children=["'border-style':'groove'"],
            style={'border-style':'groove', 'backgroundColor':'rgb(221,213,141)'}
        ),
        html.Br(),
        html.Div(
            children=["'border-style':'ridge'"],
            style={'border-style':'ridge', 'backgroundColor':'rgb(0,255,255)'}
        ),
        html.Br(),
        html.Div(
            children=["'border-style':'inset'"],
            style={'border-style':'inset', 'backgroundColor':'rgb(221,213,141)'}
        ),
        html.Br(),
        html.Div(
            children=["'border-style':'outset'"],
            style={'border-style':'outset', 'backgroundColor':'rgb(0,255,255)'}
        ),
        html.Br(),
        html.Div(
            children=["'border-style':'none'"],
            style={'border-style':'none', 'backgroundColor':'rgb(221,213,141)'}
        ),
    ]
)

if __name__ == '__main__':
    app.run(debug=True)
border-color&border-width
続いて,border-colorとborder-widthを確認したいと思います。
border-colorで線の色を,border-widthで太さを設定できます。

コードは↓です
app = Dash(__name__)

app.layout = html.Div(
    children=[
        html.Div(
            children=["'border-color':'rgb(255, 0, 0)', 'border-width':'0.5px'"],
            style={'border-color':'rgb(255, 0, 0)', 'border-width':'0.5px' ,'border-style':'solid'}
        ),
        html.Br(),
        html.Div(
            children=["'border-color':'rgb(0, 255, 0)', 'border-width':'2px'"],
            style={'border-color':'rgb(0, 255, 0)', 'border-width':'2px' ,'border-style':'solid'}
        ),
        html.Br(),
        html.Div(
            children=["'border-color':'rgb(0, 0, 255)', 'border-width':'5px'"],
            style={'border-color':'rgb(0, 0, 255)', 'border-width':'5px' ,'border-style':'solid'}
        ),
    ]
)

if __name__ == '__main__':
    app.run(debug=True)
まとめ
本記事では,dashのhtmlの使い方を確認しました。
htmlは下表のような種類があります。
| html.H1 | 見出しタグ |
| html.H2 | 見出しタグ |
| html.H3 | 見出しタグ |
| html.H4 | 見出しタグ |
| html.H5 | 見出しタグ |
| html.H6 | 見出しタグ |
| html.div | divタグ,対象範囲をブロック要素とできる |
| html.B | 太字,強調表現 |
| html.I | イタリック体の表示 |
| html.Br | 改行 |
| html.Hr | 水平線の表示 |
| html.Label | ラベルタグの表示 |
| html.U | アンダーラインの表示 |
| html.Textarea | テキストエリアの表示 |
| html.Var | 変数や引数を示す,イタリック体で表示 |
また,これらのhtmlタグはstyleによって表示方法を設定できます。
styleについては,下表を確認ください。
| font-size | 文字サイズ |
| font-style | 文字のスタイル(斜体にするかどうか) normal: 標準,italic: 斜体 |
| font-weight | 文字の太さ normal: 標準(400) bold: 太字(700) 100〜900: 太字 |
| fontFamily | 文字のフォント種類 |
| color | 文字の色 |
| backgroundColor | 背景の色 |
| height | 要素の高さ |
| width | 要素の幅 |
| textAlign | 文字の水平方向の位置 left: 左揃え right: 右揃え center: 中心揃え justify: 両端揃え |
| padding | 要素の内側の余白 |
| margin | 要素の外側の余白 |
| position | 要素の位置 static: デフォルト,位置指定なし relative: 元の位置から相対位置で指定 absolute: 位置指定された親要素から絶対位置で指定 fixed: ビューポートを基準に固定 sticky: 画面をスクロールしても指定位置で固定 |
| display | 要素の表示設定 block: 新しい行に要素を表示 inline: 他のインライン要素と同じ行内で表示 inline-block: サイズを変更できインラインで表示 none: 要素の非表示 |
| border-style | 線の種類 solid: 実線 dashed: 点線 dotted: 破線 double: 二重線 groove: 凹型の境界線 ridge: 凸型の境界線 inset: 内側に押し込まれた境界線 outset: 外側に膨らんだ境界線 none: なし hidden: 隠れた線 |
| border-color | 線の色 |
| border-width | 線の太さ |
| border-radious | 要素の角の丸みの設定 |
| opacity | 要素の透明度 |
| box-shadow | 要素に影を追加 |
冒頭のdashコードはこちら
#ライブラリのインポート
from sklearn import datasets
import pandas as pd
import plotly.graph_objects as go
from dash import Dash, html, dcc

#ワインデータの読み込み
data =  datasets.load_wine()
X=data['data']
Y=data['target']
wine_X = pd.DataFrame(X, columns=data['feature_names'])
df_wine = wine_X.copy()
df_wine['target']=Y
df_wine

#ヒストグラムの作図
fig = go.Figure()
fig.add_trace(go.Histogram(x=df_wine['alcohol'],
                           name='wine',
                           marker=dict(color='red',
                                       line=dict(color='black',
                                                 width=1),
                                       opacity=0.8,
                                       pattern=dict(fgcolor='blue',
                                                    shape='/',
                                                    size=10)),
                           ))
# 背景,軸の色
fig.update_layout(plot_bgcolor="white", margin=dict(t=50, b=50, l=100, r=100))
fig.update_xaxes(title='alcohol',linecolor='black', gridcolor='gray',mirror=True)
fig.update_yaxes(title='count',linecolor='black', gridcolor='gray',mirror=True)


#Dashアプリの作成
app = Dash(__name__)
#コンテナ作成
app.layout = html.Div(
    children=[
        html.H1(
            children=['Data Visualization'],
            style={'font-weight': 'bold',
                   'textAlign':'center',
                   'color':'rgb(255, 255,255)',
                   'backgroundColor': 'rgb(137, 0, 13)',
                   'font-style': 'italic',
                   'border-style':'ridge',
                   'border-color':'rgb(160, 160, 160)'
                   }
            ),
        html.P(children=['下記のデータは, '], style={'display':'inline'}),
        html.Div(children=['scikit-learn'], style={'color':'rgb(140, 73, 255)', 'display':'inline'}),
        html.Div(children=['のToyDatasetsから', html.B('Wineのdataset'),'を使用し表示しています。'], style={'display':'inline'}),
        html.Hr(),
        html.Div(children=['Wineのデータセットの中から,alcoholのデータについてヒストグラムを作図します。'], style={'display':'inline'}),
        html.Br(),
        html.Div(children=[' 縦軸 '], style={'display':'inline', 'border-style':'inset', 'backgroundColor':'rgb(0,255,255)'}),
        html.Div(children=[': 頻度'], style={'display':'inline'}),
        html.Br(),
        html.Div(children=[' 横軸 '], style={'display':'inline', 'border-style':'inset', 'backgroundColor':'rgb(0,255,255)'}),
        html.Div(children=[': alcohol'], style={'display':'inline'}),

        dcc.Graph(
                id='example-graph',
                figure=fig
                ),
    ],
    style={'width':'70%'}
)
#アプリの実行
if __name__ == '__main__':
    app.run(debug=True)

コメント